
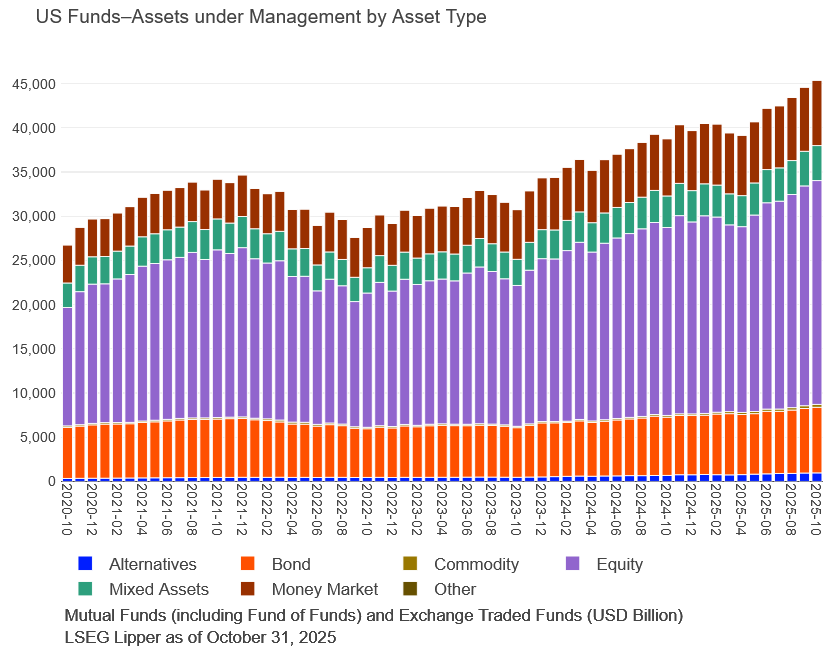
Total assets under management in the US fund market grew $789.2 billion (+1.8%) for October and stood at $45,389.0 billion at the end of the month. Estimated net inflows accounted for $236.5 billion, while $552.7 billion was added because of the positively performing markets. On a year-to-date basis, assets increased exceptionally $5,704.2 billion (+14.4%).
Included in the overall year-to-date asset change figure were $944.9 billion of estimated net inflows. Compared to a year ago, assets increased exceptionally $6,622.6 billion (+17.1%). Included in the overall one-year asset change figure were $1,411.8 billion of estimated net inflows. The average overall return in US dollar terms was a positive 0.9% at the end of the reporting month, underperforming the 12-month moving average return by 0.2 percentage points and underperforming the 36-month moving average return by 0.3 percentage points.

Fund Market by Asset Type, October
Most of the net new money for October was attracted by money market funds, accounting for $135,395.3 million, followed by bond funds and equity funds, at $78,687.5 million and $17,339.7 million of net inflows, respectively. Mixed Assets funds, at negative $12,416.6 million, were at the bottom of the table for October, bettered by other funds and commodity funds, at $0.0 million and $6,163.1 million of net inflows, respectively.
All asset types posted positive returns for the month, with commodity funds at 1.9%, followed by mixed asset funds and alternatives funds, at 1.1% and 1.0% returns, respectively, on average. The best performing funds for the month were commodity funds at 1.9%, followed by mixed assets funds and alternatives funds, at 1.1% and 1.0% returns, respectively, on average. Money Market funds, at positive 0.3%, outperformed, followed by bond funds and equity funds, at positive 0.6% and positive 1.0%, respectively.

Fund Market by Asset Type, Year to Date
For the year to date, most of the net new money was attracted by bond funds, accounting for $468,489.1 million, followed by money market funds and alternatives funds, at $466,098.7 million and $122,441.0 million of net inflows, respectively. Mixed Assets funds, at negative $117,204.4 million, were at the bottom of the table for the year to date, bettered by equity funds and other funds, at $42,351.0 million of net outflows and $0.0 million of net inflows, respectively.
All asset types posted positive returns for the year to date, with equity funds at 16.3%, followed by commodity funds and mixed assets funds, at 14.1% and 13.8% returns, respectively, on average. The best performing funds for the year to date were equity funds at 16.3%, followed by commodity funds and mixed assets funds, at 14.1% and 13.8% returns, respectively, on average. Money Market funds, at positive 3.1%, outperformed, followed by bond funds and alternatives funds, at positive 5.8% and positive 11.9%, respectively.

Fund Market by Asset Type, Last Year
Most of the net new money for the one-year period was attracted by money market funds, accounting for $753,725.1 million, followed by bond funds and alternative funds, at $529,716.4 million and $155,571.6 million of net inflows, respectively. Mixed Assets funds, at negative $141,697.7 million, were at the bottom of the table for the one-year period, bettered by other funds and commodity funds, at $0.0 million and $44,953.2 million of net inflows, respectively.
All asset types posted positive returns for the one-year period, with equity funds at 16.8%, followed by alternatives funds and mixed assets funds, at 14.3% and 14.1% returns, respectively, on average. The best performing funds for the one-year period were equity funds at 16.8%, followed by alternatives funds and mixed assets funds, at 14.3% and 14.1% returns, respectively, on average.
Money Market funds, at positive 3.8%, outperformed, followed by bond funds and commodity funds, at positive 5.9% and positive 13.7%, respectively.

Lipper US Classifications, October
Looking at Lipper’s fund classifications for October, most of the net new money flows went into Money Market USD (+$134,416.9 million), followed by Bond USD Medium Term and Equity US (+$27,400.8 million and +$11,457.6 million). The largest net outflows took place for Equity US Sm&Mid Cap, at negative $18,200.4 million, bettered by Mixed Asset USD Aggressive and Equity US Income, at negative $2,972.2 million and negative $2,845.9 million of net outflows, respectively.
The best performing funds for the month were Equity Argentina, at plus 34.4%, followed by Equity Korea and Equity Theme – Alternative Energy, at plus 19.1% and plus 9.4% returns, respectively, on average. Equity Japan Income, at minus 4.1%, was the worst performer, bettered by Alternative Dedicated Short Bias and Equity Sector Gold & Precious Metals funds, at minus 4.0% and minus 3.8%, respectively.
Lipper US Classifications, Year to Date
For the year to date, most of the net new money flows went into Money Market USD (+$464,784.9 million), followed by Bond USD Medium Term and Equity US (+$120,455.6 million and +$87,505.3 million). The largest net outflows took place for Equity US Sm&Mid Cap, at negative $154,581.4 million, bettered by Mixed Asset USD Aggressive and Target Maturity MA USD 2025, at negative $36,200.8 million and negative $22,465.7 million of net outflows, respectively.
The best performing funds for the year to date were Equity Sector Gold & Precious Metals, at plus 106.4%, followed by Equity Korea and Equity Poland, at plus 80.5% and plus 63.5% returns, respectively, on average. Alternative Dedicated Short Bias, at minus 34.1%, was the worst performer, bettered by Commodity Agriculture and Equity Turkey funds, at minus 8.2% and minus 4.3%, respectively.
Lipper US Classifications, Last Year
For the one-year period, most of the net new money flows went into Money Market USD (+$750,752.5 million), followed by Equity US and Bond USD Medium Term (+$173,593.8 million and +$146,530.0 million). The largest net outflows took place for Equity US Sm&Mid Cap, at negative $146,760.5 million, bettered by Mixed Asset USD Aggressive and Equity Sector Healthcare, at negative $42,321.8 million and negative $28,908.1 million of net outflows, respectively.
The best performing funds for the one-year period were Equity Sector Gold & Precious Metals, at plus 77.7%, followed by Equity Greece and Alternative Currency Strategies, at plus 65.9% and plus 65.5% returns, respectively, on average. Alternative Dedicated Short Bias, at minus 37.4%, was the worst performer, bettered by Equity Philippines and Commodity Agriculture funds, at minus 9.3% and minus 8.8%, respectively.
5 Stocks Our Experts Predict Could Double In the Next Year
By submitting your email, you'll also get a free pivot & flow membership. A free daily market overview. You can unsubscribe at any time.