
Market Update
For the past five months, the major indexes have moved sideways inside a broad consolidation (Darvas Box). That type of action often represents digestion after a strong advance. However, over the past month, conditions have weakened. Key support levels highlighted in were broken, risk on assets such as Bitcoin have continued to soften, and internal measures are flashing caution.
As always, I am not concerned with predicting what the market will do. I am concerned with responding to what it actually does. When those support levels failed, I progressively added short hedges to client accounts. That decision proved helpful as volatility increased. With the United States and Israel recently launching military strikes against Iran, Monday could bring higher than normal volatility in the markets.
QQQ: Consolidation at Risk
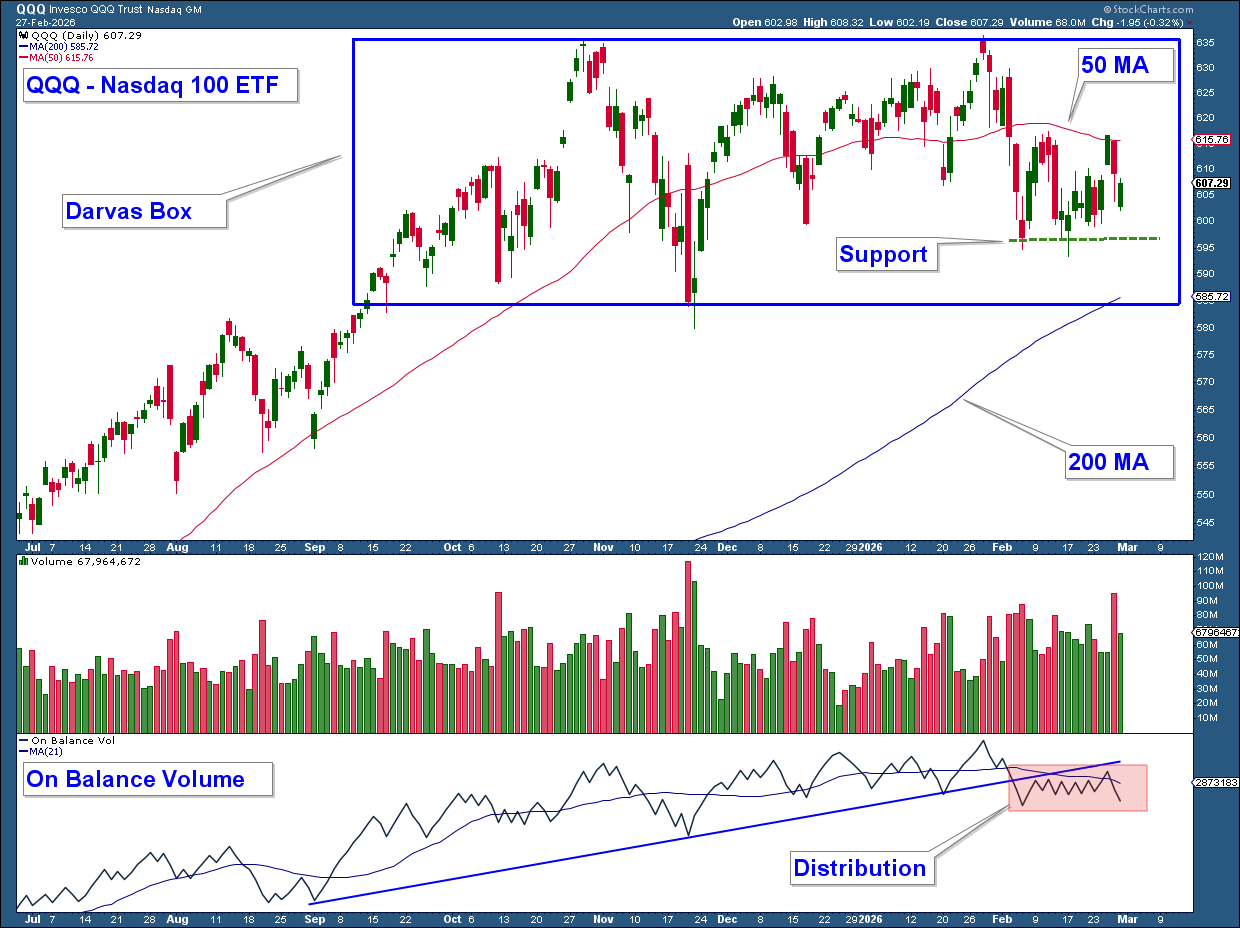
The first chart shows the Nasdaq 100 ETF, , which remains within a five-month consolidation box, noted on the chart as a Darvas Box. A breakout above the top of this range would be very bullish and signal that the market has finished digesting prior gains and may be preparing for another move higher. On the other hand, a decisive move below the lower end of this consolidation would suggest the pattern is turning into a topping formation and would signal increasing market weakness.
Recently, price action has begun to lean toward the weaker side of that range.
The index has fallen below the 50-day moving average, which is now acting as resistance. Two rally attempts in February stalled at that level. Below the current price sits the 200-day moving average, which is still trending higher and now resides inside the consolidation range. If price holds above it, the longer-term structure remains intact. A decisive break below it would be a much stronger bearish signal.
I also highlighted a key February support level on the chart. A move below that level would further increase the odds of lower prices.
In the lower panel is On Balance Volume. In last month’s newsletter, I noted that a break below its six-month uptrend line would indicate distribution. That break occurred in early February. Since then, OBV has remained below that trendline. In addition, the chart shows numerous tall red volume bars, reflecting heavy selling pressure. Together, this suggests that institutional distribution has been occurring over the past month, another sign that the market is becoming increasingly weak.
VIX: A Warning Beneath the Surface
The second chart shows the inverted in the top panel and the in the lower panel. Because the VIX is inverted, a falling line on the chart actually represents a rising VIX.
The VIX has been rising since December 2025, which is highlighted by a red trendline. During this same period, the S&P 500 has traded sideways. Normally, the VIX moves opposite the market. When it rises while the market is flat or advancing, it is a warning sign.
I have highlighted two prior examples on the chart.
From August 2025 into late October 2025, the VIX rose while the market continued higher. That period was followed by a roughly 5 percent decline.
From December 2024 into February 2025, the VIX rose while the market traded sideways. That period was followed by a roughly 20 percent decline.
In both cases, the VIX warned of rising risk before the market moved lower. We are seeing a similar setup now. That does not guarantee a decline, but it is a condition that deserves respect.
Client Account Update
Rather than selling our strongest stocks outright, I chose to add short hedges as conditions weakened. Many of our holdings continue to show strong relative strength, particularly in areas tied to AI infrastructure. Because those stocks are still trending well, I elected to hedge market exposure rather than liquidate positions prematurely.
Currently, client accounts are heavily hedged. I have added short exposure in large-cap technology, semiconductors, and financials as the market deteriorated. This positioning helped accounts produce a positive month despite major indexes falling in February.
If market conditions stabilize and leadership stocks continue to outperform, I may maintain a long short structure. However, if we see a broader breakdown where strong stocks begin to fail alongside the indexes, I would likely reduce equity exposure more aggressively and move to a more defensive allocation until a healthier environment emerges.
As always, allocation decisions will be driven by what the market does, not what I think it should do.
5 Stocks Our Experts Predict Could Double In the Next Year
By submitting your email, you'll also get a free pivot & flow membership. A free daily market overview. You can unsubscribe at any time.