
I was looking for big red candlesticks across indexes, and yesterday, they delivered. Those who took the opportunity to go short can place a stop at yesterday’s close.
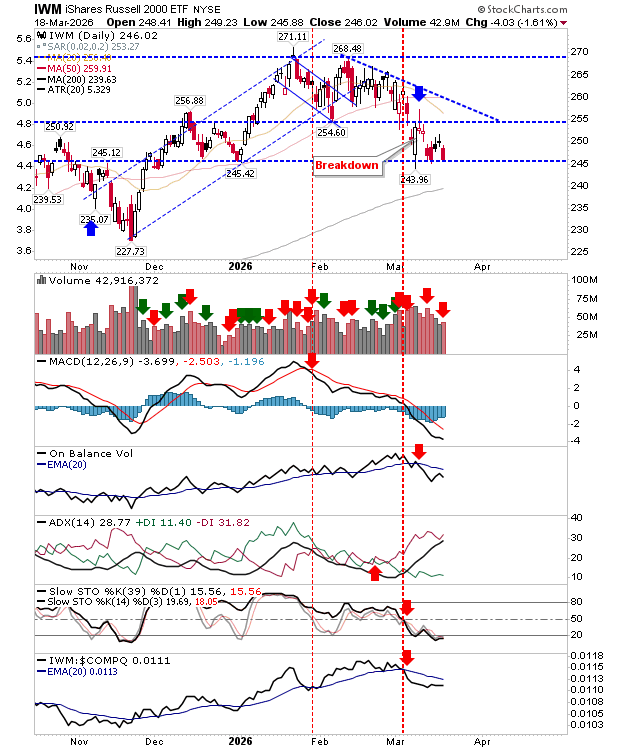
The () experienced a higher-volume distribution day amid net bearish technicals. Yesterday’s loss closed on $245/6 support, but another day’s worth of selling will open up a test of the 200-day MA, and maybe a follow-through move down to $228.

The is back down at 7,800, and it’s looking like further losses are on the cards. The 200-day MA should be an initial test, but a measured move target would open up 7,400, which is also near the November swing low. Convergences are good, unless you are a bull.

The is testing its 200-day MA on a nasty sell-off. The best case scenario is a spike low, so if this sells off in morning trading but starts attracting buyers after lunch, then it may be worth a long trade – particularly if we get a spike low and a close above the 200-day MA.

Same applies for the .

Although I was disappointed with as I really was expecting some sizable upside follow-through, instead, we got a red candlestick that threatens to undercut the steady work buyers had clocked in the past couple of weeks. This may morph into a scrappy base that could last months, which at best, is a hold.

The index to watch is the . The index was the first to undercut its 200-day MA, which is warning for indexes currently testing their 200-day MAs. Watch what happens today. If we are to see spike lows for indexes testing 200-day MAs, then this has to make a comeback today.

If there is a shorting opportunity to consider, it could be . A bearish cloud-cover candlestick at converged 20-day and 50-day MAs, with a couple of spike high doji last week (denoting supply), on weak technicals, says short.

With the war in Iran not looking like it will finish soon, traders are now having to position themselves for the long haul, and that appears to be from the sidelines.
5 Stocks Our Experts Predict Could Double In the Next Year
By submitting your email, you'll also get a free pivot & flow membership. A free daily market overview. You can unsubscribe at any time.