Market Dynamics Unveiled
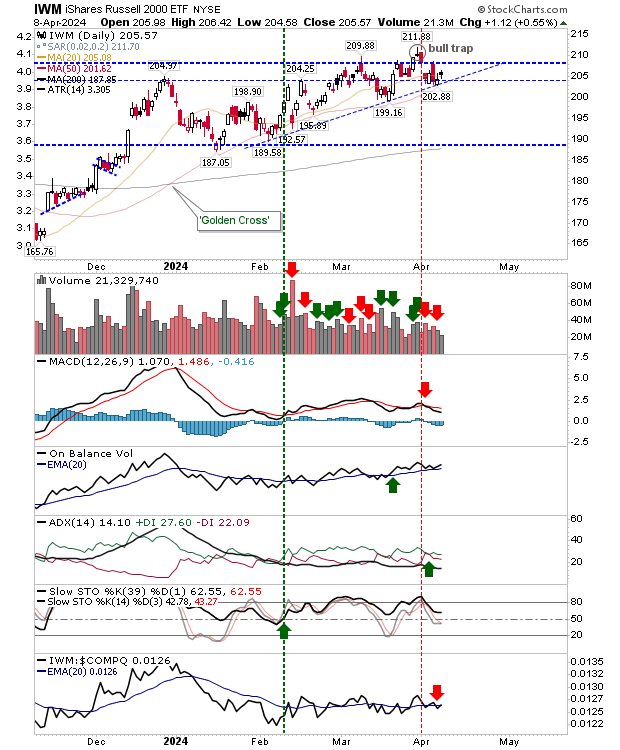
When it comes to a potential swing trade ripe with anticipation, look no further than the Russell 2000 Index. The index stands at a threshold where it could either invalidate the late March ‘bull trap’ or breach the ascending triangle support with a significant downward move.
Technical analysis still leans towards bullish sentiment, although the recent MACD trigger ‘sell’ raises slight concerns. It’s worth noting that ‘sell’ signals triggered above the MACD zero line are typically considered weak signals, often hinting at an opportune moment to engage in covered calls rather than hastily disposing of a position.
The on-balance volume continues its upward trend, and momentum, as indicated by stochastics, confidently stays above the 50 mid-level. In the event of a trendline break, anticipate a retreat to the $187-189 range, marking a probable continuation of a time-based sideways consolidation.

Challenges for S&P 500 and Nasdaq
A different narrative unfolds for the S&P 500 as it retraces back to its breakout price, preparing to confront its ‘bull trap’. This index has already breached trendline support, with a small doji formation at resistance hinting at trader indecision.
Further downside movements are expected with the MACD gaining downward momentum. Although the On-Balance-Volume is holding steady, the declining momentum from its overbought state signifies the end of the prior bullish trend.

State of the S&P 500
The S&P 500 finds itself in a similarly delicate position as the Nasdaq, both having experienced a MACD trigger ‘sell’. However, the S&P 500 shows signs of weakness in the On-Balance-Volume, with a corresponding ‘sell’ trigger. While the momentum appears more bullish compared to the Nasdaq and Russell 2000, it has recently shifted out of an overbought state.

Future Expectations
Looking ahead, it’s reasonable to anticipate the formation of sideways (time) consolidations for both the S&P 500 and Nasdaq. Such movements are likely to trigger a breakdown from the ‘ascending triangle’ pattern observed in the Russell 2000 ($IWM).

