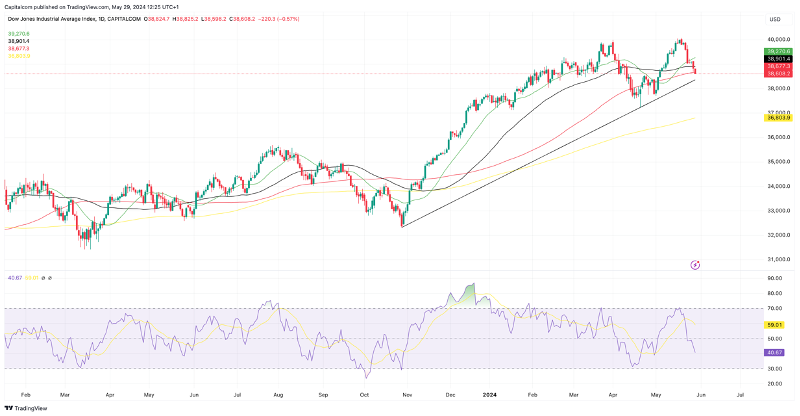
US equities are experiencing a mixed bag of emotions this week. The Dow Jones Industrial Average (US 30) is on a downward trajectory due to resurfacing concerns related to inflation, while the tech-heavy Nasdaq Composite Index is forging ahead, albeit facing increasing resistance. The recent surge in Nvidia (NASDAQ: NVDA) shares bolstered Tuesday’s upward movement, with the chip-maker leaping over 7% last week to reach a new peak, showcasing an impressive performance streak.
However, apprehensions surrounding the forthcoming PCE (Personal Consumption Expenditures) data in the US are putting a lid on the upswings in the equity markets. Persistent worries about inflationary pressures are fueling concerns about a potential rate cut by the Federal Reserve, gradually dampening hopes for any rate reduction in 2024. The PCE data scheduled for release on Friday is expected to provide some short-term guidance to stock traders. A weaker data outcome could entice new buyers, propelling the Nasdaq higher and possibly reversing the short-term momentum in the Dow Jones. Conversely, if the data reflects ongoing inflationary pressures, a widespread sell-off could intensify.
From a technical standpoint, the Nasdaq has more leeway to retreat compared to the Dow Jones. The tech-laden index has been holding onto recent gains more steadfastly, as indicated by a robust RSI hovering near the 70 mark. In contrast, the RSI for the Dow Jones has slipped back towards 40, a level that previously provided support. The immediate focal point is the upward trendline originating from the lows of October 2023 and April 2024, currently situated at 38,357. A breach below this threshold could potentially pave the way for a retreat towards 37,000.
Dow Jones (US 30) Daily Chart

Past performance is not a reliable indicator of future results.
The Nasdaq also boasts an upward trendline that is poised to offer support. Originating from the troughs in April and May, this trendline sits 3.8% below the current index level at 17,960 – a greater margin compared to the 0.8% buffer seen in the Dow Jones. Presently, there is a sense of hesitation around the market peaks, with the index retracing 1% in Wednesday’s afternoon trading session in London. The substantial influence of Nvidia’s performance on market momentum could signal stormier waters ahead, especially if traders begin to perceive the stock as overvalued and look to capitalize on potential pullbacks.
Nasdaq Composite (US 100) Daily Chart

Past performance is not a reliable indicator of future results.
Disclaimer: This information is provided for educational and informational purposes only. It does not constitute investment advice and does not consider the individual financial circumstances or objectives of any investor. Any mention of past performance should not be interpreted as a dependable indicator of future results or performance. Social media channels mentioned are not applicable for UK residents.
Keep in mind that spread bets and CFDs are intricate instruments that carry a high risk of rapid financial loss due to leverage. 84.01% of retail investor accounts lose money when trading spread bets and CFDs with this provider. Make sure you comprehend how spread bets and CFDs operate and assess whether you can withstand the considerable risk of losing your investment.
This information is not to be construed as investment advice or endorsement.

