Big investors, akin to whales of the financial world, have set their sights on Stellantis with a distinctly bullish stance.
Delving into the options trading history of Stellantis (STLA) reveals a total of 8 trades being made.
An intriguing observation emerges when scrutinizing the nature of these trades – 50% were initiated with optimistic expectations, while the remaining 50% adopted a more pessimistic outlook.
Of the identified trades, 2 involved put options totaling $96,112, whereas 6 were call options amounting to $608,800.
Insights into Projected Price Targets
Analysis of the Volume and Open Interest on these contracts indicates that, over the past 3 months, the whales have honed in on a price range spanning from $15.0 to $18.0 for Stellantis.
Evaluating Volume & Open Interest Progression
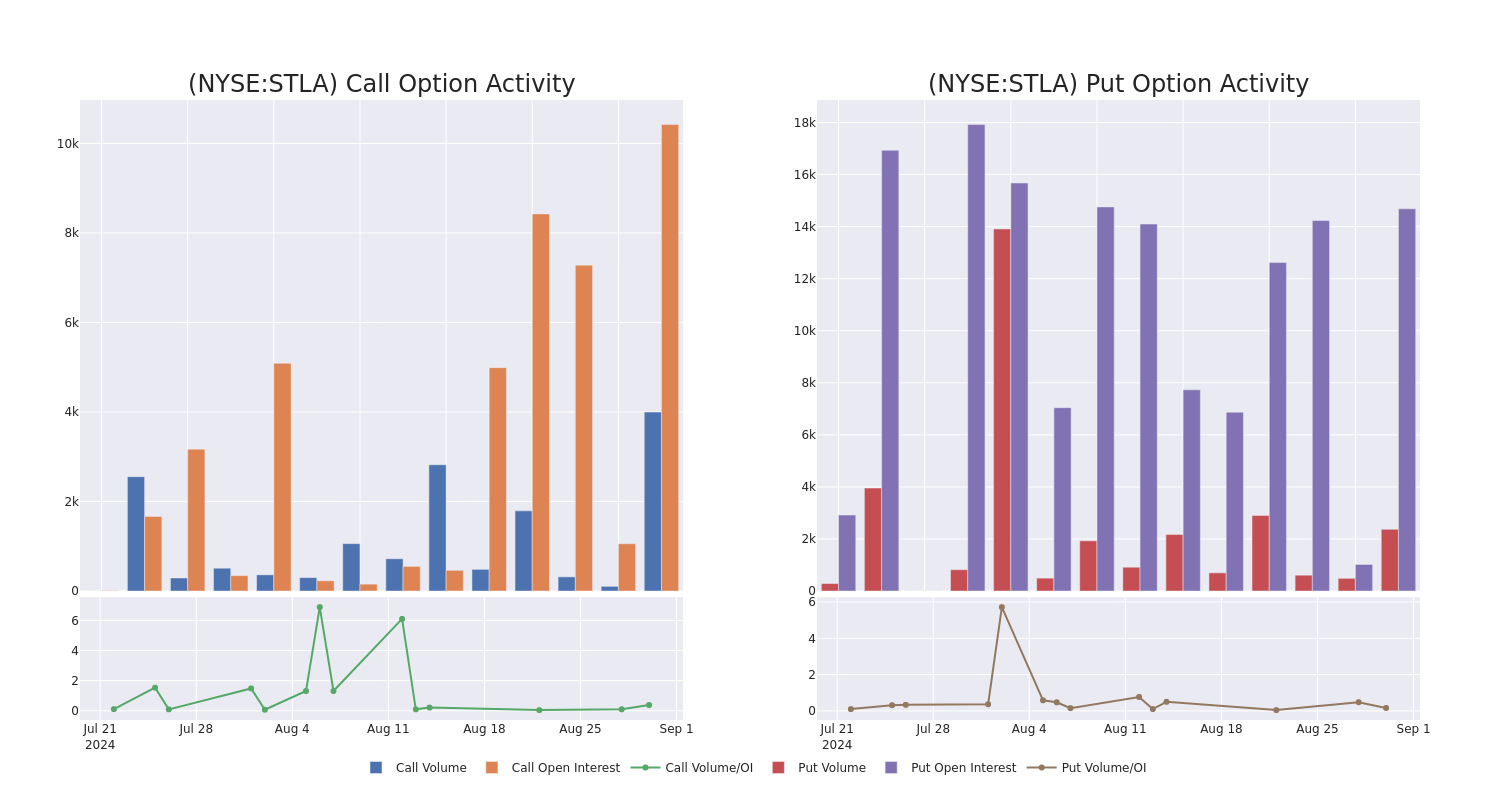
For traders navigating the realm of options, closely monitoring the volume and open interest dynamics proves to be a strategic maneuver. This data serves as a barometer for gauging liquidity and interest in Stellantis’s options across various strike prices. Examining the fickle ebbs and flows of the volume and open interest for calls and puts encompassing a strike price range from $15.0 to $18.0 within the last 30 days reveals valuable insights.
Moving Averages of Stellantis Call and Put Volume: A Comprehensive Overview

Key Options Discoveries
| Symbol | PUT/CALL | Trade Type | Sentiment | Exp. Date | Ask | Bid | Price | Strike Price | Total Trade Price | Open Interest | Volume |
|---|---|---|---|---|---|---|---|---|---|---|---|
| STLA | CALL | TRADE | BEARISH | 01/16/26 | $3.5 | $3.4 | $3.4 | $15.00 | $212.8K | 1.9K | 798 |
| STLA | CALL | TRADE | BULLISH | 01/16/26 | $3.4 | $3.1 | $3.34 | $15.00 | $143.6K | 1.9K | 1.3K |
| STLA | CALL | SWEEP | BEARISH | 12/20/24 | $0.75 | $0.65 | $0.7 | $18.00 | $104.0K | 4.2K | 1.4K |
| STLA | CALL | TRADE | BULLISH | 01/16/26 | $2.3 | $2.15 | $2.24 | $17.00 | $87.3K | 4.2K | 400 |
| STLA | PUT | SWEEP | BULLISH | 01/17/25 | $1.35 | $1.25 | $1.3 | $17.00 | $55.0K | 14.6K | 1.0K |
Insights into Stellantis
Formed on Jan. 16, 2021, through the merger of Fiat Chrysler Automobiles and PSA Group, Stellantis NV emerged as the world’s fifth-largest automaker, boasting a portfolio of 14 automobile brands. Despite the challenges posed by the microchip shortage, Stellantis registered sales volume of 6.2 million vehicles and revenue of EUR 189.5 billion in 2023. Notably, Europe commands the largest share of Stellantis’ global volume at 44%, with North America and South America accounting for 29% and 15%, respectively.
With a deep dive into Stellantis’s options trading behavior concluded, attention naturally shifts to the company itself. This pivot enables a detailed examination of its contemporary market positioning and performance.
Current Positioning in Stellantis’s Market
- The trading volume currently stands at 4,161,597, with STLA’s price exhibiting a slight decline of -0.18%, settling at $16.71.
- Signals from the RSI indicators hint at a potential move towards an overbought territory for the stock.
- An upcoming earnings announcement is slated for 167 days from now.
Professional Analyst Insights on Stellantis
Across the past month, insights from 1 industry analyst have shaped the narrative surrounding this stock, projecting an average target price of $16.44.
- Analysts at Jefferies have revised their rating downward to Hold, simultaneously adjusting the price target to $16.
Options, while harboring elevated risk compared to straightforward stock trading, offer amplified profit potential. Seasoned options traders adeptly navigate this risk by immersing themselves in continuous education, judiciously scaling in and out of trades, heeding several indicators, and maintaining a vigilant eye on market movements.

