Charting Delta Air Lines’ Bullish Trajectory
Delta Air Lines Inc, symbol DAL on NYSE, isn’t just whisking customers away to exotic locales; it’s also reaching new heights on the stock market.

Chart created using Benzinga Pro
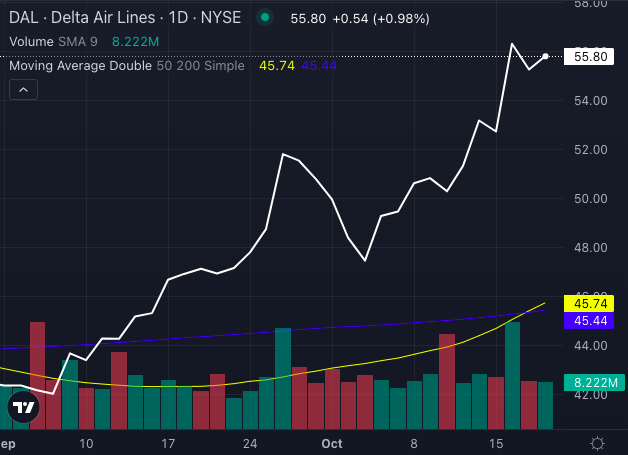
Approaching its 100th anniversary, Delta is enjoying a Golden Cross moment — a robust sign where the 50-day moving average surpasses the 200-day, hinting at smooth skies ahead for potential takeoff.
Delta Air Lines’ Stock Chart Supports A Bullish Trajectory
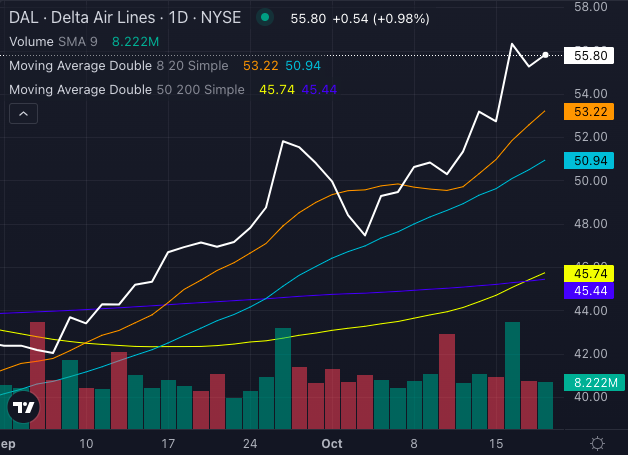
Currently trading around $55 per share, Delta is soaring above its five, 20, and 50-day exponential moving averages, indicating significant buying pressure.

Chart created using Benzinga Pro
With Delta’s eight-day SMA at $53.22 and 20-day SMA at $50.94, the stock’s charts exude bullish sentiment, effortlessly cruising above critical levels.
Even with the 200-day SMA at a distant $45.44, Delta’s stock seems like a bargain.

Chart created using Benzinga Pro
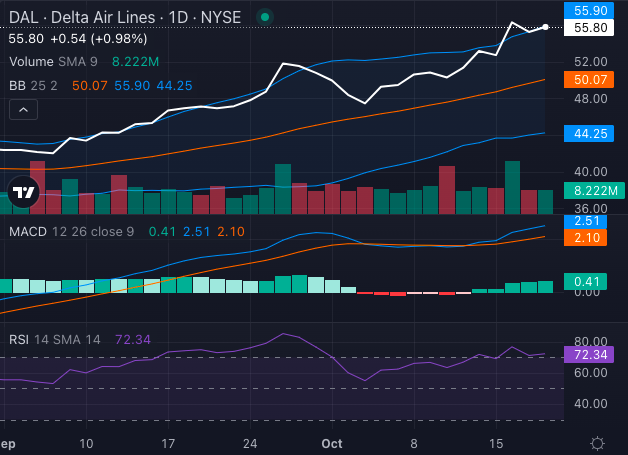
The MACD indicator further fuels optimism, standing at 2.51, presenting another strong bullish indication.
Despite an RSI of 72.34, signaling Delta’s stock has entered overbought territory, a potential correction might be on the horizon, even amid this bull ride.
The Bollinger Bands stretching from $44.25 to $55.90 reveal that the stock has broken past crucial resistance levels, enhancing the technical argument for more gains.
Delta’s New Cabins: Elevated Flight Experience
But it’s not just the charts painting a rosy picture. Delta is introducing new cabin interiors, commencing with its Boeing 757s later this autumn.
Infusing premium materials and residential-style lighting, the airline is marrying comfort with elegance, striving to redefine the in-flight journey.
However, the conundrum arises — will Delta’s bullish momentum persist as it revamps its fleet, or will a brief pause ensue?
Presently, Delta has a tailwind both in the skies and on the stock market.
Read Next: $1000 Invested In Delta Air Lines 15 Years Ago Would Be Worth This Much Today
Image: Shutterstock

