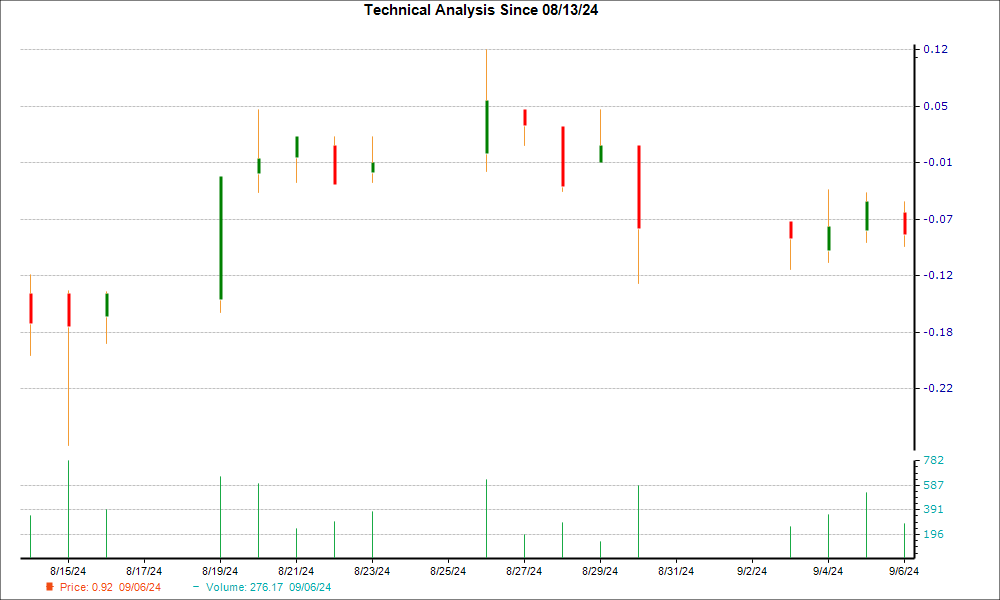
The recent price trajectory of Canaan (CAN) on the NASDAQ exchange has been bearish, with the stock experiencing an 8.1% decline over the past two weeks. Nonetheless, the emergence of a hammer chart pattern during its last trading session suggests a potential trend reversal on the horizon. This formation hints at a shift in momentum towards bulls as they potentially establish a supportive base for the stock.
While the hammer pattern signifies a nearing bottom with a probable depletion of selling pressure, the growing optimism among Wall Street analysts about the future earnings of this cryptocurrency-mining computer manufacturer serves as a strong fundamental catalyst that could drive a reversal in the stock’s performance.

Exploring the Hammer Chart Pattern and Trading Strategies
The hammer chart pattern is a well-known formation in candlestick charting. It features a small candle body with a minor difference between the opening and closing prices, along with a significant difference between the day’s low and either the open or close, forming a long lower wick or vertical line. This formation, where the length of the lower wick is at least double that of the real body, resembles the shape of a ‘hammer.’
During a downtrend, characterized by bearish dominance, a stock typically opens lower than the previous day’s close and closes even lower. On the day the hammer pattern emerges, indicating a continuation of the downtrend, the stock reaches a new low. However, a surge of buying interest materializes after finding support at the day’s low, propelling the stock to close near or slightly above its opening price.
When witnessed at the bottom of a downtrend, the hammer pattern suggests a potential loss of control by bears over the stock price. The successful intervention of bulls in preventing further decline indicates a possible reversal in the prevailing trend. This pattern can manifest on various timeframes—ranging from one-minute to weekly charts—and is valuable to both short-term traders and long-term investors.
Despite its significance, the hammer chart pattern should be used in conjunction with other bullish indicators due to its inherent limitations, which are often tied to its placement on the chart.
Factors Reinforcing the Likelihood of a Trend Reversal for CAN
The recent uptrend in earnings estimate revisions for CAN presents a favorable fundamental signal. Positive adjustments to earnings estimates typically correlate with near-term price appreciation.
Over the past 30 days, the consensus EPS estimate for the current fiscal year has surged by 33.3%. This significant uptick indicates a consensus among sell-side analysts covering CAN that the company is expected to deliver better earnings than previously anticipated.
Furthermore, CAN currently holds a Zacks Rank #2 (Buy), placing it within the top 20% of over 4,000 stocks ranked based on earnings estimate revisions and EPS surprises. Stocks with Zacks Rank #1 or 2 customarily outperform the broader market.
The Zacks Rank has demonstrated its efficacy as a timing indicator, aiding investors in pinpointing when a company’s prospects are on the upswing. Therefore, the Zacks Rank of 2 for Canaan offers a robust fundamental signal for a potential turnaround in the company’s shares.

