Most Popular
Analysis of Wednesday’s Notable Option Activity for META, BKNG, MSFT
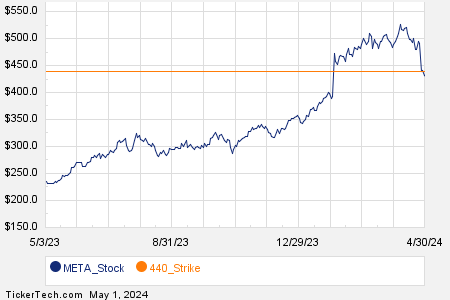
Meta Platforms Inc (META) Options Activity Noteworthy trading activity unfolded among the S&P 500 … Read more

Meta Platforms Inc (META) Options Activity Noteworthy trading activity unfolded among the S&P 500 … Read more

Growth stocks serve as the adrenaline your portfolio craves. These companies, with their focus … Read more

Source: iQoncept / Shutterstock Landmark Bancorp (NASDAQ:LARK) unveiled its first-quarter 2024 financial results, sending … Read more

If you’re seeking opportunities to fortify your financial portfolio, look no further. Delve into … Read more

Trade wars are always destructive. The current escalation in the chip wars will be … Read more
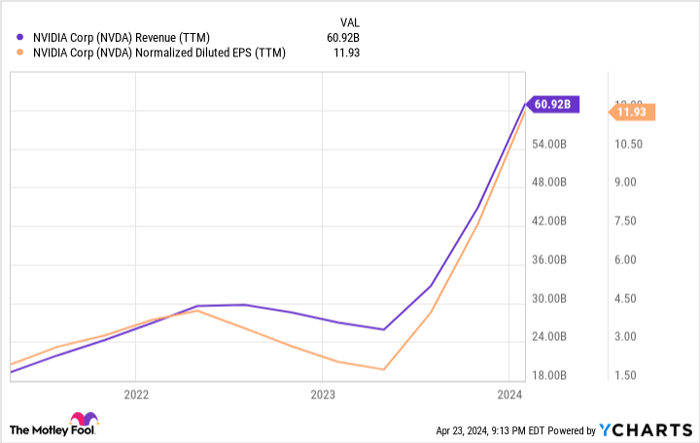
Following a period of strong growth, artificial intelligence (AI) stocks experienced a slowdown in … Read more
The Dow Jones Industrial Average, consisting of 30 blue-chip stocks known for their robustness, … Read more
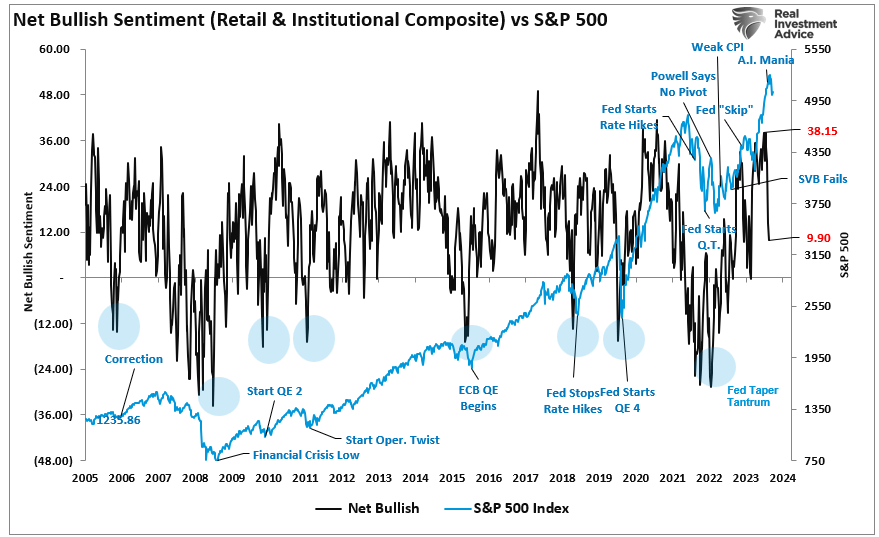
Amidst a tumultuous reversal in bullish sentiment, investors find solace in the unwavering strength … Read more
Unraveling the Resilience of Microsoft: A Deep Dive into the AI Stock Landscape The … Read more
Looking Beyond the Financials As Macerich (NYSE: MAC) held its Q1 2024 earnings call … Read more