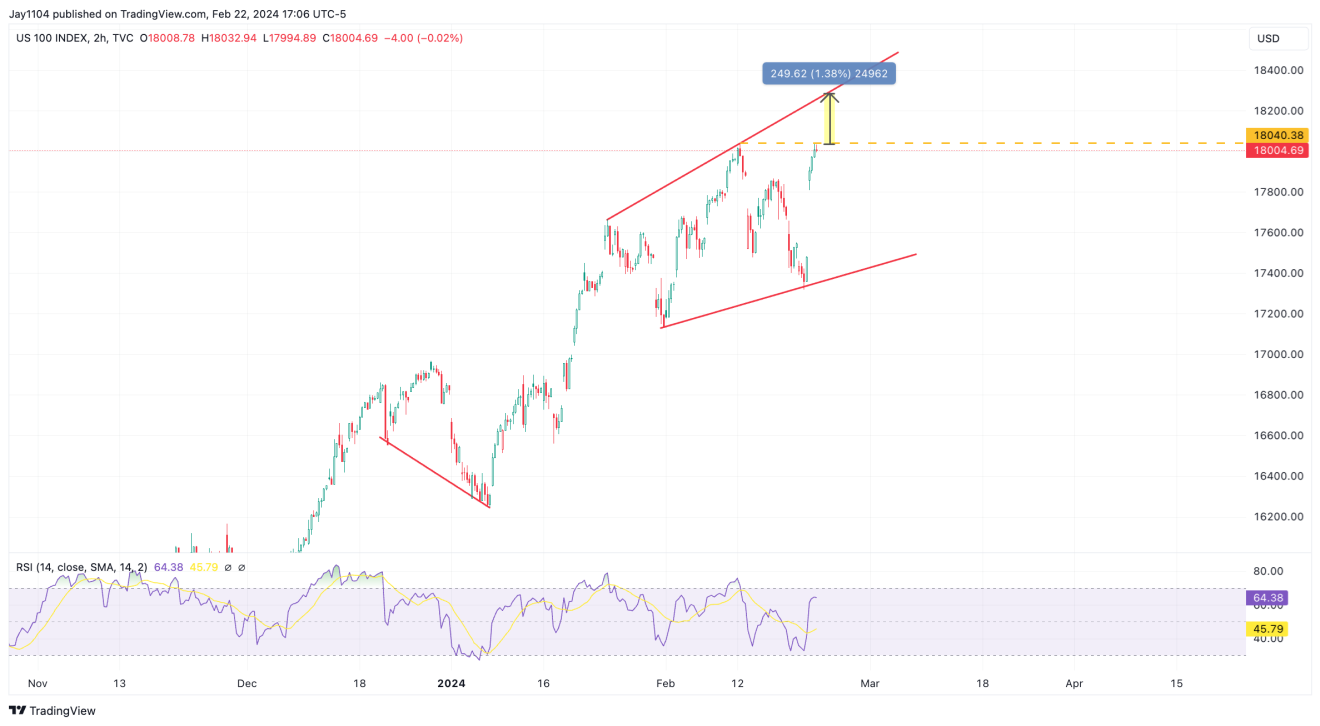
The Rise and Resistance of Nasdaq 100
Yesterday, NVIDIA’s stock soared, effortlessly bypassing the $750 resistance to land at $785. While this meteoric rise may seem excessive for a mere $2 billion uptick in guidance, catapulting the market cap by $277 billion in a single day, it sets a curious stage for the Nasdaq 100’s potential ascent.
A Glimpse into the Market Dynamics
The options market hinted at the possibility of breaching $800 post-results if the stock could surpass $750. And indeed, it did. Yet, amidst this exuberance, the broader market seems unchanged, with the holding steady at 14 and interest rates maintaining their status quo.
Lingering below the February 12 zenith, Nasdaq’s closure around 18,000 ushers in a sense of intrigue—is it the herald of a broadening wedge or the specter of a potential double top?

Simultaneously, the tech ETF exhibited a 3% surge yesterday, merely bridging the gap from February 13.

Oddly, fixed strike implied volatility escalated for March OPEX and three months ahead, alongside a spike in 1-month implied correlation—an unusual tandem, to say the least.
The real delight—or dilemma—emerged as real yields reclaimed 2% territory for the first time since the tumult post the December FOMC meeting.

With 1-year inflation breakevens surging by 3.6% to the pinnacle of the past year, and credit spreads defying the tightening financial landscape to dip further down, the market whirls within a bizarre ballet.
The Puzzling Dynamics
Despite the seeming chaos, Nvidia’s soaring yesterday may not have rewritten the market’s grand narrative. The real magic lies in the daily dance of market forces, where each move unfurls its own uncertainty and intrigue.

