The Nasdaq 100 and the Market Landscape
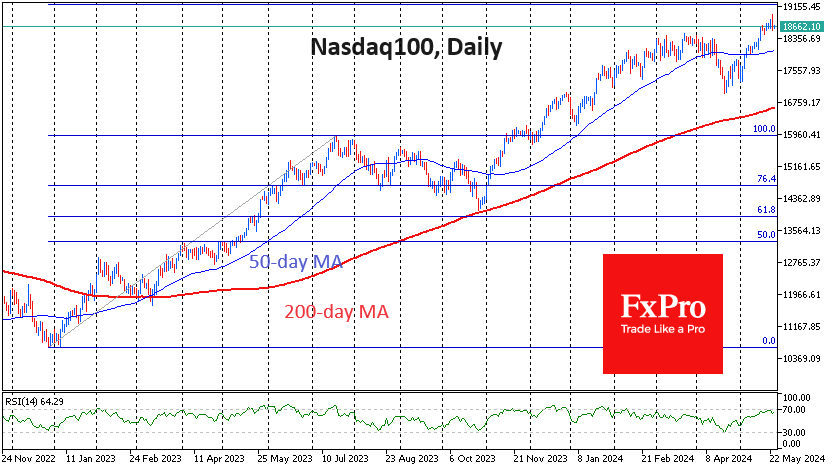
The Nasdaq 100 continues to drive growth in US indices, exerting influence on markets globally. Approaching the 19,000 level in May, the index has surged over 11% from its April lows. Despite a substantial wave of market downturns, questions linger – is this the dawn of a lengthy correction?
Technical Analysis and Market Predictions
Technically, the Nasdaq 100 finds itself on the cusp of the overbought zone on RSI daily timeframes. Contrary to popular belief, this zone often signifies intensified growth, albeit with heightened unpredictability.
Resilience and Historical Patterns
The index’s current position, merely 1% above the previous peak, is bolstered by buyer interest. Following an April correction that alleviated short-term overheating, the Nasdaq 100’s trajectory mirrors a classic Fibonacci pattern.
Looking Ahead: Market Reactions
Last year’s correction from July to October adhered to a classic Fibonacci pattern, with the index nearing 61.8% of the initial rally and flirting with the 200-day moving average. A traditional response entails a subsequent rally to 161.8%, approximately 19,200.
Market Sentiment and Economic Indicators
Amidst this backdrop, the Nasdaq 100 contends with a crucial resistance area. A potential pause for consolidation looms before the next upward surge.
Economic Policy and Market Implications
While a shift in sentiment or adverse economic data could alter the trajectory, a stable decline in equity indices seems unlikely. The recent dip was prompted by short-term profit-taking due to robust macroeconomic indicators hinting at tighter monetary policies.
Charting the Course: Technical Signals
An essential technical indicator to monitor is a drop below the previous consolidation near 18,300, which could signal a trend reversal in the horizon.
The FxPro Analyst Team

