Volatility Strikes as Markets Grapple with Bearish Trends
Markets spent most of the day in bearish territory, with only the salvaging something into the close.
Nvidia’s Earnings Jolt Sends Ripples Through Markets
Nvidia’s 5%+ loss in after-hours on its earnings release won’t help the mood, but it could play as a bullish opportunity into today’s open.
Testing Key Support: Nasdaq and Russell 2000 in Focus
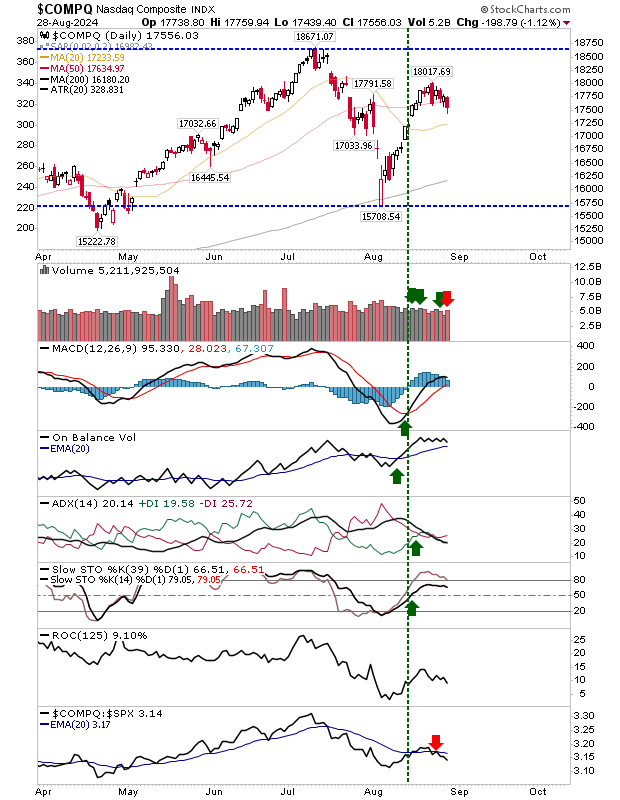
Speaking of the key indexes, the Nasdaq had the worst of yesterday’s action, undercutting its 20-day MA, although neither it nor its 50-day MA offered much in the way of support on its last test. Volume climbed to register as distribution. I will be looking for more of the same today.

Market Movement: Semiconductor Index Under the Microscope
With Nvidia’s results still impacting the market today, keep an eye on a potential test of the 200-day moving average in the Semiconductor Index. Although the index has already tested this moving average earlier this month, the likelihood of the second test holding is slim.

Market Sentiment: Dow Jones Looks to Overcome Resistance
For today, Nividia will dominate the action, but most of the damage is likely to be done pre-market, so watch for a rally off the inevitable opening gap lower. The Dow Jones Industrial Average ($INDU) did well to make back on its losses and it could follow through with an upside today, although Nvidia’s results will likely keep a lid on things for a few days.
Technicals are net positive and there is nothing bearish here.

Russell 2000 Maintains Resilience Amid Market Unrest
The Russell 2000 continues to play off the ‘black’ candlestick reversal from Monday. I will be looking for some expansion (further losses) today with support coming on the next test of its 50-day MA. Technicals remain net bullish but watch for a ‘sell’ trigger in On-Balance-Volume.

Index Performance Comparison: S&P 500 Versus Nasdaq
The S&P 500 is in a position similar to the Dow Jones, although it didn’t gain as much ground as the latter index by the close of business yesterday. Despite this, the index continued to outperform the Nasdaq, and will likely continue to do so today.


