
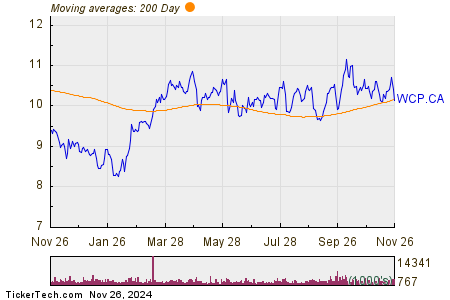
In trading on Tuesday, shares of Whitecap Resources Inc (TSX: WCP.TO) crossed below their 200 day moving average of $10.17, changing hands as low as $10.12 per share. Whitecap Resources Inc shares are currently trading off about 2.7% on the day. The chart below shows the one year performance of WCP shares, versus its 200 day moving average:

Looking at the chart above, WCP’s low point in its 52 week range is $8.15 per share, with $11.31 as the 52 week high point — that compares with a last trade of $10.15.
Free Report: Top 8%+ Dividends (paid monthly)
Also see:
Funds Holding FTNT
Institutional Holders of YOGA
S&W Seed Historical PE Ratio
5 Stocks Our Experts Predict Could Double In the Next Year
By submitting your email, you'll also get a free pivot & flow membership. A free daily market overview. You can unsubscribe at any time.