Most Popular
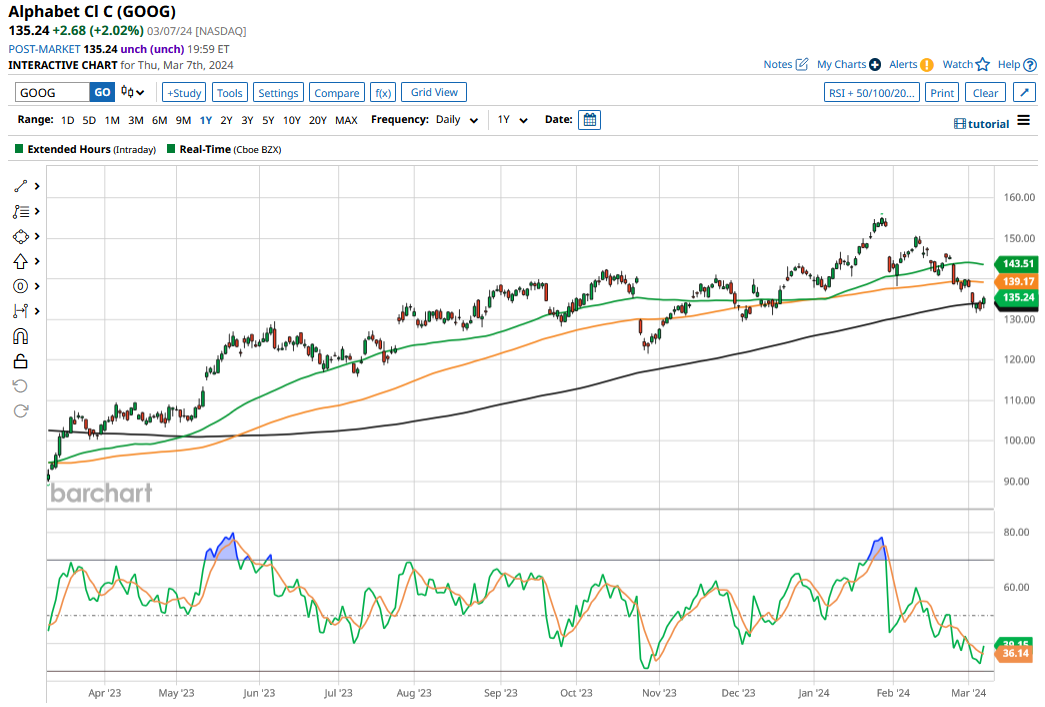
The Unpredictable Path Ahead: Alphabet’s Battle for Dominance in 2030 and Beyond
A Shaky Start to 2024 As the tech sector wrestles with the turbulence of … Read more

A Shaky Start to 2024 As the tech sector wrestles with the turbulence of … Read more

The New Era of Cannabis Reform President Joe Biden utilized his State of the … Read more

Apple Embraces Inclusivity Reports suggest that Apple Inc. is gearing up to introduce cutting-edge … Read more

The Rise of AI Stocks: A Glimmer of Hope in Turbulent Markets Escaping the … Read more

Comparing Modern Giants to Past Titans Present-day top stocks exhibit significantly lower valuations when … Read more
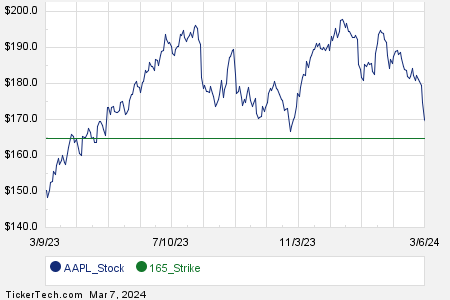
As the digital age marches on, Apple Inc (AAPL) investors brace for the latest … Read more

Nasdaq Soars While BJ’s Wholesale Faces Sales Slump The Nasdaq’s Soaring Triumph U.S. stocks … Read more
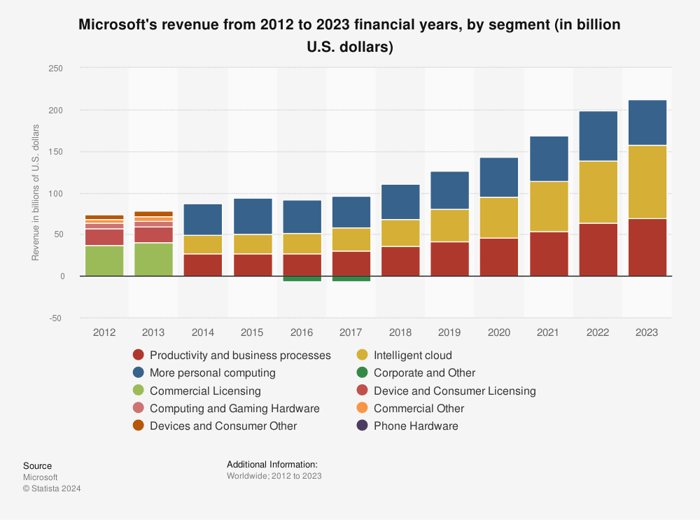
While the financial world gasped in awe, earlier this year, Microsoft (NASDAQ: MSFT) crossed … Read more
Understanding how income taxes are computed remains a complex puzzle for many Americans unversed in the nuances of tax laws and terminology. Terms like tax rate and tax burden can often be baffling.
A tax rate signifies the percentage at which an individual or business is levied, with considerable variations based on income levels. On the other hand, tax burden represents the total sum of taxes paid, encompassing state and local taxes. This distinction assumes a pronounced importance when contrasting the wealthiest and poorest 20% in every state.
To discern the disparities in tax burdens nationwide, GOBankingRates delved into state, federal, and local data to unravel the tax burdens of affluent and impoverished individuals for single filers and married joint filers in each state. Harnessing data from the U.S. Census Consumer Expenditure Survey and the Bureau of Labor Statistics Consumer Expenditure Survey, this comprehensive analysis employed an in-house income tax calculator to ascertain the effective and marginal tax rates on average incomes for both demographic segments in every state.
The study additionally scrutinized the annual expenditures in each state, multiplying them by the average combined sales tax to compute the total sales tax expenditure for each state. The cumulative sum expended on federal and state income taxes was added to the aggregate spent on sales tax and then divided by the average income. Notably, property tax was excluded from the analysis due to data inconsistencies.
The wealthiest 20% invariably bear a more substantial tax burden; however, despite this higher tax load, these individuals command significantly more wealth than the poorest quintile. Thus, each tax dollar exacts a heavier toll on the poorest 20%. For instance, in a scenario where a state’s tax burden for single filers stands at 27.50%, this does not signify that the wealthiest 20% pay 27.50% more than the poorest quintile. Instead, it signifies that they contribute 27.50% more of their personal income compared to the poorest 20%.
Difference in Tax Burden: 21.56%
Difference in Tax Burden: 18.65%
Difference in Tax Burden: 18.94%
Difference in Tax Burden: 16.21%
Arizona Single filing for the richest 20% Average annual income of the top 20%: … Read more

Big spenders, commonly known as whales in the financial world, have recently showcased a … Read more