ETF Outflow Analysis
Examining the recent shifts in shares outstanding within ETFs reveals intriguing dynamics in the financial landscape. Notably, the Invesco FTSE RAFI US 1000 ETF (Symbol: PRF) stands out with an approximate $168.6 million outflow, marking a 2.4% decrease from 184,060,000 to 179,620,000 shares.
Stock Performance
Within PRF, significant movements were observed among its key underlying components. Citigroup Inc (Symbol: C) experienced a 2.8% decline, CVS Health Corporation (Symbol: CVS) decreased by 0.4%, and Ford Motor Co. (Symbol: F) saw a 1.4% dip in their trading value.
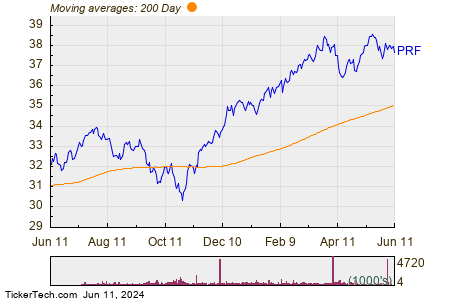
The one-year price performance chart of PRF compared to its 200-day moving average unveils compelling insights into its market trajectory, where the share price fluctuated between $30.29 and $38.6195 over the year, culminating in the recent trade at $37.70.
Technical Analysis
It is worth noting that analyzing PRF’s recent share price concerning its 200-day moving average can provide valuable technical perspectives for investors navigating the complex market terrain.
ETF Trading Dynamics
ETFs operate akin to stocks, with investors trading “units” instead of shares. These units can be freely traded in the market, reflecting the demand and supply dynamics shaping the financial landscape. Monitoring weekly changes in shares outstanding helps identify noteworthy inflows and outflows, shedding light on the evolving market sentiment.
Notably, significant outflows in ETFs like PRF can influence the buying and selling activities of underlying holdings, thereby impacting the individual components held within these funds.
![]() Discover more about other ETFs experiencing notable outflows »
Discover more about other ETFs experiencing notable outflows »
Related Resources:
Exploration of Services Stocks Hedge Funds Are Buying
Insightful Videos on SFL
Historical Data on CMG Market Capitalization

