
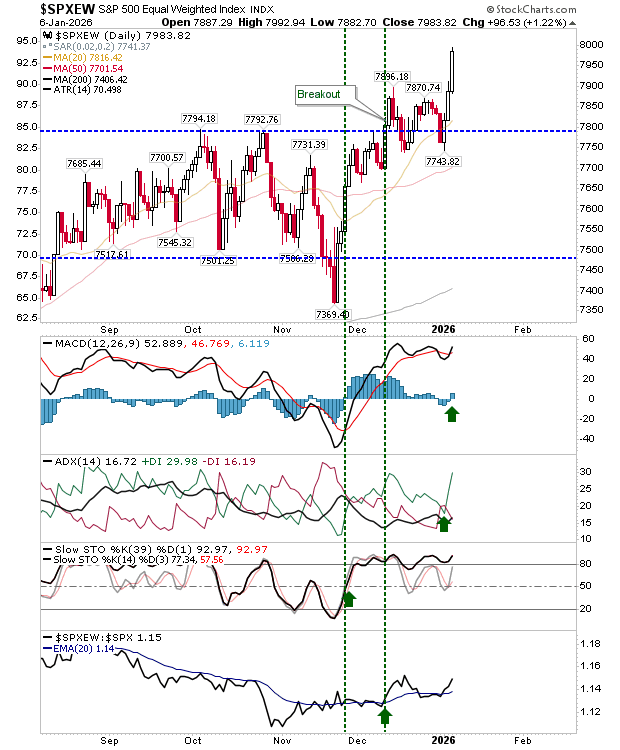
A positive day on higher volume for many assets. The best mover was the , and the in particular, as it posted a second solid day in a row to confirm the breakout. If there is to be a measured move higher, then look for the equal-weighted S&P 500 to get to 8,200, and 7,350 for the S&P 500.


The () hasn’t yet posted a new high, but it’s heading in the right direction on higher volume accumulation. Technicals are mostly bullish, with the MACD on the verge of a new ’buy’ signal; when this happens, technicals will be net bullish.

The has so far only managed a weak gain, although have posted a new all-time high, albeit on a series of gap moves on net bullish technicals.

Also helping is the improvement in . It has recovered from a potential ’bear flag’, shifting to a sideways pattern. However, because it managed a capitulation on a spike low, on significant volume, and is (well) below its 200-day MA, it’s well placed to mount a new rally. Should this rally emerge, then it will help the continue with its rally.

With such positive moves in the market, we need to consider how far these rallies can go. It won’t take much to push them to relative extremes, but bulls have firm control of markets.
5 Stocks Our Experts Predict Could Double In the Next Year
By submitting your email, you'll also get a free pivot & flow membership. A free daily market overview. You can unsubscribe at any time.