
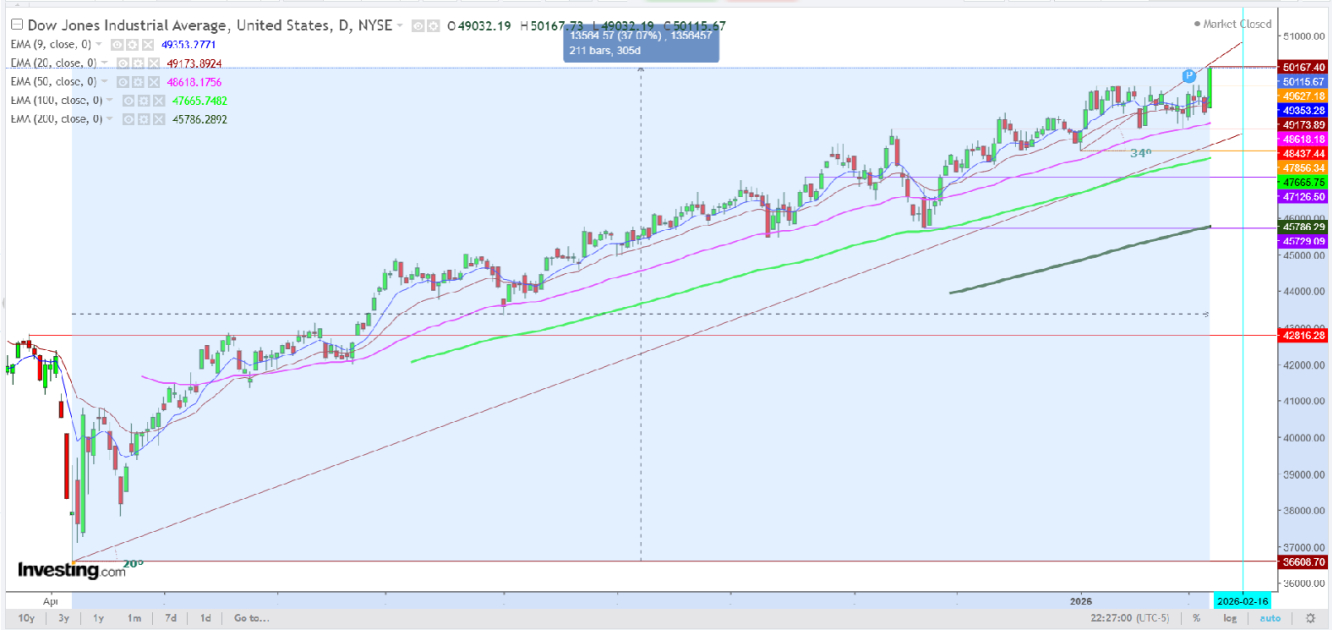
Upon evaluating the , I note that it reached the 50,000 level after a 305-day period beginning on April 7, 2025, following a low of 36,608. This represents a surge of approximately 37.07%.
I find it is still not convincing enough to celebrate while I compare this move with other US Indices on Feb.7, 2026, amid slower growth and global uncertainty – still moved higher along with and the as the deviation of surge looks evident enough to question the reliability of the moves experienced by all the three on Jan. 6, 2026.
On Friday, U.S. stocks posted their best day since May 2025, as a sense of calm prevailed after a volatile week marked by hefty losses in the tech sector amid a repositioning of the artificial intelligence trade. The Dow tested a record high at 50,167.73 before closing the day at 50,115.67, after testing the day’s low at 4,932.19, after trading in a narrow range between 48.880 to 49,627 – a level, where the Dow had been constantly making futile attempts to cross this significant resistance since Jan.7, 2026, finally succeeded on Feb. 6, 2026 with 2.47% gain.
Technically, this uptrend appears to be substantially strong, as the Dow has consistently maintained a position above the 50 EMA since May 2, 2025, when it broke out above this significant resistance level.
But continued to struggle to find a breakout above the next significant resistance at 42,816.28, a level from where the Dow started to slide after finding resistance on March 26, 2025 and tested the low at 36,608.70 on April 7, 2025, from where the current uptrend started.
Now, I find that this potential surge still needs confirmation amid the currently prevailing geopolitical concerns between the U.S. and Iran as the meeting, to avoid direct confrontation, which was scheduled for Feb. 6, 2026 in Oman, between the diplomates of the U.S. and Iran met without a face-to-face interaction, ended with no constructive outcome, with no future dateline for further discussion, indicates the significance of griming situation between both the countries.
At the same time, the S&P 500, after opening the day at 6,816.74, tested the day’s low at 6,816.74 and the day’s high at 6,944.89, closed the day at 6,932.30 – a gain of 1.97% on Friday.
Meanwhile, the benchmark S&P 500 index rose 1.9% to close at 6,927.09 points, its best day since May 27, 2025. The tech-heavy NASDAQ Composite index added 2.2% to end at 23,031.21 points. S&P 500 on April 7, 2025, after testing the low at 4,834.83, experienced advent of an uptrend that resulted in a surge of approximately 44.64% in 296 days, when tested a record peak at 7,002.16 on Jan. 28,2026, following this move started to slide downward and teste a low at 6,784.16 on Feb.5, 2026 from where continued to move upward a nd tested a high at 6,944.89 on Feb.6, 2026, and closed the day at 6,932.30.
Undoubtedly, the daily candle, formed on Feb.9, 2026, is above the significant support at the 100 EMA and closed the day after piercing the significant resistances at the 50 EMA, 20 EMA and 9 EMA, ensuring continuity of the uptrend if successfully finds a breakout above the significant resistance at the record peak tested on Jan. 28, 2026 at 7,002.16. NASDAQ Composite index is also maintaining an uptrend since April 7, 2025, after testing the day’s low at 14,785.57, has experienced a surge of approximately 62.44% in 205 days before testing a record peak on Oct.29, 2025 at 24020.55 before sliding downward and tested a low at 21,892.34 on Nov.21, 2025, and regain a small uptrend and continued to trade in a narrow range between 22,682 to 23,696, and again tested a peak at 23,988.55, and again moved downward to test a low at 22,455 on Feb.5, followed by Feb.6, 2026 candle which started the day at 22,645.30, tested the day’s low at 22586.96, and day’s high at 23,088.40 before closing the day at 23,031.21.
Though this candle, formed last Friday, is bullish but holding just above the immediate support at the 100 EMA (22,897.77 while the 9 EMA is trying to move below the 20 EMA, could form a bearish crossover above this candle, as this candle has been formed after a slide from the second peak.
In conclusion, I observe that after studying the quantum of uptrend seems deviated on some points as fist peak formation by the S&P 500 and NASDAQ Composite indexes while the candle formed by the Dow John Industrial Average index was only at a record peak, tested on Feb. 6, 2026, extending scepticism over the strength of this rally in 2026 while the U.S. is going through a critical time to deal with Iran’s issue.
***
Disclaimer: Readers are advised to take any position in U.S. indices futures at their own risk, as this analysis is only based on observations.
5 Stocks Our Experts Predict Could Double In the Next Year
By submitting your email, you'll also get a free pivot & flow membership. A free daily market overview. You can unsubscribe at any time.